

Contributions
Abstract: P654
Type: Poster Presentation
Presentation during EHA22: On Saturday, June 24, 2017 from 17:30 - 19:00
Location: Poster area (Hall 7)
Background
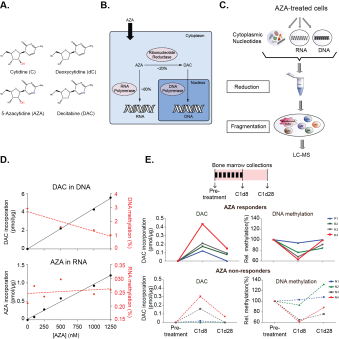
The cytidine analog 5’-Azacitidine (AZA, Fig. A), a DNA demethylating agent, is the primary drug for the treatment of high-risk Myelodysplastic Syndrome (MDS) and Chronic Myelomonocytic Leukaemia (CMML), and response is associated with improved survival benefits. However, only ~50% of treated patients will ever respond to AZA and the molecular basis for poor response is poorly understood. It is unclear whether non-responders to therapy have different rates of AZA uptake into their cells and/or AZA incorporation into nucleic acids compared to AZA responders, nor whether these might relate to DNA methylation in vivo.
Aims
We aimed to develop an analytical method capable of simultaneously detecting all the subcellular fractions of AZA (Fig B) within the bone marrows of patients undergoing AZA therapy, while also assessing DNA and RNA methylation levels. This would provide the most comprehensive snapshot of the intracellular pharmacokinetics of AZA therapy in vivo as a first step towards better understanding AZA resistance.
Methods
We have developed a new method utilising mass spectrometry to accurately quantify all the different subcellular fractions of AZA within the same sample (Fig C). Using an Orbitrap mass spectrometer with very high mass resolution, we have achieved the first mass separation of DAC and AZA from all naturally occurring isotopes of deoxycytidine and cytidine respectively (a difference of less than 1 Da), thus enabling accurate quantification. We utilised subcellular fractionation to obtain purified quantities of DNA- and RNA-incorporated nucleotides, as well as free unincorporated nucleotides present in the cytoplasm. We developed a reduction reaction to reduce the spontaneous hydrolysis of AZA and DAC, thereby greatly improving the sensitivity of detection.
Results
Using our new method, we report for the first time direct simultaneous quantification of: (1.) DNA-incorporated DAC, (2.) intracellular, free DAC, (3.) methyl deoxycytidine in DNA, (4.) RNA-incorporated AZA, (5.) intracellular, free AZA, and (6.) methyl cytidine in RNA within the same sample. We demonstrate an inverse correlation between the amount of DAC incorporated into DNA and DNA methylation. However, no such correlation was observed between AZA incorporation and RNA demethylation (Fig D). The sensitivity and resolution of our method also enabled, for the first time, a comprehensive survey of the total intracellular pharmacokinetics of AZA in vivo in patients undergoing a standard cycle of treatment. We discovered that the bone marrow cells of AZA responders (n=4) incorporated more DAC into DNA compared to non-responders (n=4). DAC incorporation was also inversely proportional to DNA methylation levels, with greater DNA demethylation observed in the responders compared to non-responders. Furthermore, we observed two patterns in AZA non-responders, with DAC-incorporation and DNA demethylation occurring in some individuals (n=2), while other non-responders (n=2) showed low or no DAC incorporation and no DNA demethylation (Fig E). Our method also enabled us to directly prove that low DAC incorporation was not a result insufficient AZA accumulation intracellularly, as cytoplasmic measurements of unincorporated AZA and DAC were highest in the non-responders with the lowest levels of DNA-incorporated DAC. Additionally, in these non-responders, there was also concomitant increase in AZA incorporation into RNA.
Conclusion
We have developed a new method that has enabled the first comprehensive analysis of the intracellular pharmacokinetics of AZA therapy in vivo. Our results have revealed that while AZA responders incorporated AZA efficiently into DNA, leading to DNA demethylation, there were two modes of primary AZA resistance: in some non-responders, low levels of AZA incorporation into DNA likely derives from cell cycle quiescence, resulting in low amounts of DNA demethylation. However, in other non-responders who showed DAC incorporation into DNA and demethyltion, resistance arises from as-yet-unknown mechanisms not connected with AZA metabolism.
Session topic: 9. Myelodysplastic syndromes - Biology
Abstract: P654
Type: Poster Presentation
Presentation during EHA22: On Saturday, June 24, 2017 from 17:30 - 19:00
Location: Poster area (Hall 7)
Background
The cytidine analog 5’-Azacitidine (AZA, Fig. A), a DNA demethylating agent, is the primary drug for the treatment of high-risk Myelodysplastic Syndrome (MDS) and Chronic Myelomonocytic Leukaemia (CMML), and response is associated with improved survival benefits. However, only ~50% of treated patients will ever respond to AZA and the molecular basis for poor response is poorly understood. It is unclear whether non-responders to therapy have different rates of AZA uptake into their cells and/or AZA incorporation into nucleic acids compared to AZA responders, nor whether these might relate to DNA methylation in vivo.
Aims
We aimed to develop an analytical method capable of simultaneously detecting all the subcellular fractions of AZA (Fig B) within the bone marrows of patients undergoing AZA therapy, while also assessing DNA and RNA methylation levels. This would provide the most comprehensive snapshot of the intracellular pharmacokinetics of AZA therapy in vivo as a first step towards better understanding AZA resistance.
Methods
We have developed a new method utilising mass spectrometry to accurately quantify all the different subcellular fractions of AZA within the same sample (Fig C). Using an Orbitrap mass spectrometer with very high mass resolution, we have achieved the first mass separation of DAC and AZA from all naturally occurring isotopes of deoxycytidine and cytidine respectively (a difference of less than 1 Da), thus enabling accurate quantification. We utilised subcellular fractionation to obtain purified quantities of DNA- and RNA-incorporated nucleotides, as well as free unincorporated nucleotides present in the cytoplasm. We developed a reduction reaction to reduce the spontaneous hydrolysis of AZA and DAC, thereby greatly improving the sensitivity of detection.
Results
Using our new method, we report for the first time direct simultaneous quantification of: (1.) DNA-incorporated DAC, (2.) intracellular, free DAC, (3.) methyl deoxycytidine in DNA, (4.) RNA-incorporated AZA, (5.) intracellular, free AZA, and (6.) methyl cytidine in RNA within the same sample. We demonstrate an inverse correlation between the amount of DAC incorporated into DNA and DNA methylation. However, no such correlation was observed between AZA incorporation and RNA demethylation (Fig D). The sensitivity and resolution of our method also enabled, for the first time, a comprehensive survey of the total intracellular pharmacokinetics of AZA in vivo in patients undergoing a standard cycle of treatment. We discovered that the bone marrow cells of AZA responders (n=4) incorporated more DAC into DNA compared to non-responders (n=4). DAC incorporation was also inversely proportional to DNA methylation levels, with greater DNA demethylation observed in the responders compared to non-responders. Furthermore, we observed two patterns in AZA non-responders, with DAC-incorporation and DNA demethylation occurring in some individuals (n=2), while other non-responders (n=2) showed low or no DAC incorporation and no DNA demethylation (Fig E). Our method also enabled us to directly prove that low DAC incorporation was not a result insufficient AZA accumulation intracellularly, as cytoplasmic measurements of unincorporated AZA and DAC were highest in the non-responders with the lowest levels of DNA-incorporated DAC. Additionally, in these non-responders, there was also concomitant increase in AZA incorporation into RNA.
Conclusion
We have developed a new method that has enabled the first comprehensive analysis of the intracellular pharmacokinetics of AZA therapy in vivo. Our results have revealed that while AZA responders incorporated AZA efficiently into DNA, leading to DNA demethylation, there were two modes of primary AZA resistance: in some non-responders, low levels of AZA incorporation into DNA likely derives from cell cycle quiescence, resulting in low amounts of DNA demethylation. However, in other non-responders who showed DAC incorporation into DNA and demethyltion, resistance arises from as-yet-unknown mechanisms not connected with AZA metabolism.
Session topic: 9. Myelodysplastic syndromes - Biology